by Fe Sferdean
In the library’s efforts to support campus research and identify areas of engagement, a Research Lifecycle Committee was created to investigate, define, implement, and sustain the service model for supporting the research community. The committee is comprised of librarians from different areas such as Research, Learning Programs and Initiatives, Emerging Technologies, IT, Digital Preservation, Michigan Publishing, Technical Services, and the Health Sciences. With diverse expertise and perspectives, conversations during committee meetings often yielded many new insights. Examples of the topics discussed included research and data lifecycles for the social sciences, humanities, and basic and health sciences; strategies for assessing on-going campus needs; dealing with research data; data initiatives and projects; and ways of engaging more comprehensively with the campus by connecting researchers to the library services and other campus units throughout the research lifecycle.
Big task: Building and visualizing the research lifecycle model
One main focus of the committee was creating a generic research lifecycle model as a visual tool to communicate the research process and the library services to the U-M campus. Illustrating the research and data lifecycles helped the committee to analyze and discuss the definitions and overall layout of the different stages of research and how the data lifecycle is a part of the research process. Since it was challenging to agree on the best visualization, the committee decided to reconstruct the lifecycle model based on existing library services and consequently see the research process from the library’s perspective.
How did we tackle this task?
Three committee members formed a sub-group to tackle this challenge: Jeremy York (HathiTrust librarian from IT), Ye Li (Chemistry Librarian), and Fe Sferdean (CLIR postdoctoral fellow). 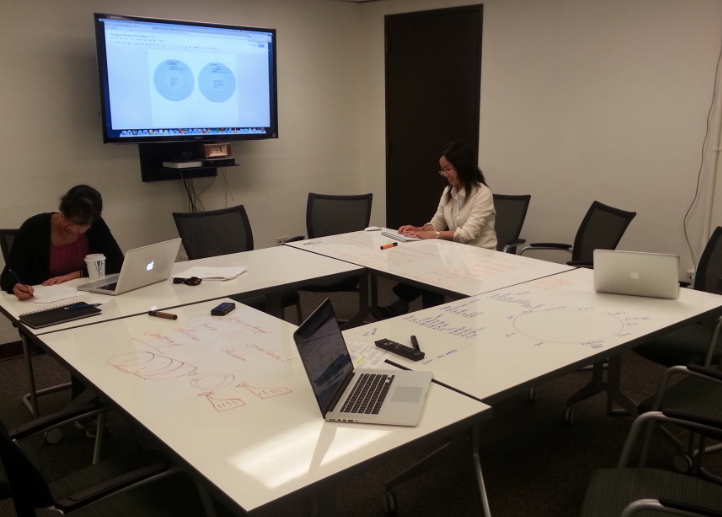
Visualization helps raise awareness
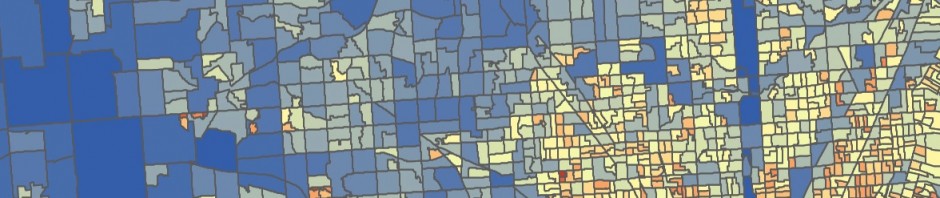
From this work, the sub-group created different visualizations. One was a poster geared for data-intensive researchers at the U-M Cyberinfrastructure (CI) Days Conference that listed the library’s data-related services offered at different stages of the research process. While the poster aimed to raise awareness of the library services, another visual—a heatmap showing the number of services offered at different stages of research—was also created with an internal, library audience in mind in order to identify gaps and potential areas for increasing support.

Overall, the work has yielded insights into how the library can better engage with the research community and how it can serve as a useful referral tool that could help librarians to identify and partner with their colleagues with different expertise across multiple departments for supporting researchers and their projects.
